In many respects, the emergence of neoliberalism since the mid-1970s has enhanced the legibility of capitalist social relationships.footnote1 New disciplines have been imposed on both workers and management. Capital incomes—dividends and interest—have dramatically increased. During the 1970s, nominal interest rates remained practically equal to inflation rates; Paul Volcker’s 1979 ‘coup’ imposed a massive hike in real interest rates, to the benefit of lenders. Larger flows of dividends began to be diverted to shareholders. The us stock market rose steadily, up to the bubble of the 1990s. The opening of commercial frontiers and the free movement of capital issued in a new stage in the globalization of the economy, accompanied by further disequilibria and imperial war. A comparison with the postwar decades suggests that, after twenty years of neoliberalism, incomes originating in the ownership and control of the means of production skyrocketed, and capitalist relations of production rule the world even more rigorously than before.
However, other developments in contemporary capitalism, it has been argued, may serve to blur class frontiers. In this account, neoliberalism has seen the emergence of a new layer of the ‘working rich’, capitalists who now receive much of their income in the form of wages, as other workers do. If they also get a large ‘partnership’ income, the same can be said of doctors and lawyers. Of course, they also benefit from capital income and capital gains—but so, too, do many other wage-earners. Capital ownership itself has been increasingly diffused downwards, both directly and indirectly, through devices such as mutual and pension funds. This in turn is said to have created a new mass layer of shareholders, salaried workers who now share, to a significant extent, the interests of the owners of the means of production.
This paper attempts to assess these claims by analysing the historical trends in capital ownership and income in the United States, centre and powerhouse of the neoliberal transformation. It suggests that class relations remain as strong as ever under the neoliberal social order, but that they have undergone a distinct reconfiguration. The cohesion between the uppermost layers—those which we have dubbed the ‘ownership–management interface’—and a broader, subordinate tier of the ‘upper salaried classes’ has been strengthened, and the gap between this bloc and the mass of the population below it has been widened. Neoliberalism has been the vector for the emergence of this ‘two-tier capitalism’ as a new framework for social relations, the institutional expression of the compact between capitalist and upper-salaried classes versus the rest.
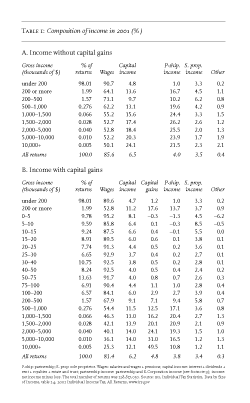
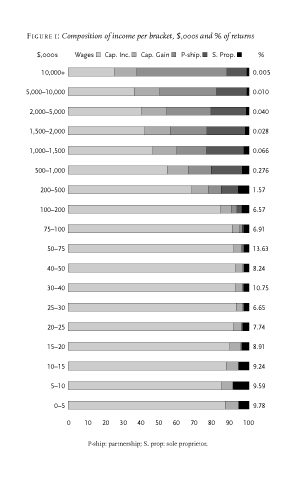
What, first of all, is the actual composition of household income in the us, from top to bottom of the social pyramid? Table 1 presents a breakdown of incomes for 2001, with and without capital gains. For the great mass of the population—98 per cent, around 125 million households—with an annual gross income of less than $200,000, wages, including pensions, account for 90.7 per cent of income; this figure is barely altered (to 89.6 per cent) when capital gains are included. Turning to the remaining 2 per cent—just over 2 million households—whose tax return is above $200,000 dollars, wages still account for nearly two-thirds of annual income, or 64.1 per cent, although this now falls to 52.8 per cent with capital gains included. Even at the very apex of the pyramid—the top 0.005 per cent (6,836 households) with incomes of over $10 million—wages still account for 50.1 per cent, excluding capital gains; the figure drops to 25.3 per cent when they are included. Figure 1 shows the dramatic expansion of capital income and gains as components of income, once the threshold of $200,000 is passed.
Placing this breakdown of top-level income in historical perspective allows us to trace the variations in this income pattern over time.footnote2 Figure 2 shows both the share of total us household income received by the top 0.01 per cent since World War i, and its component parts.footnote3 It suggests a periodization of three stages:
How does this pattern compare to historical shares of income for broader layers of the us population? Figure 3 shows the trajectories for various fractiles within the top 90–100 per cent of us households. Here, a clear distinction emerges, first, between the lower two fractiles, 90–95 and 95–99, and the top 1 per cent (99–99.9, 99.9–99.99 and 99.99–100). In contrast to the continuing slow decline experienced by the top 1 per cent in the postwar decades, the share of income accruing to the 90–95 and 95–99 fractiles grew steadily from 1945 (in spite of the limited divergence from the beginning of the 1980s). The common profile of the three fractiles composing the top 1 per cent is striking and can be explained by their similar income composition. In 2000, the average income of the top 1 per cent, including capital gains, was $833,140.footnote5 Between 1917 and 1940, this fractile had received on average 16.9 per cent of total us household income; this fell to an average 10.9 per cent during the first postwar decade, 1946–55, and to 8.4 per cent in 1973; it then soared to reach 19.6 per cent in 2001.
The importance of partnership income for the top fractions of the us population, documented in Table 1 above, requires some explanation. In 2001, the income of the top 1.99 per cent, including capital gains, consisted of 13.7 per cent partnership income, compared to 11.2 per cent for capital income.footnote6 Here, it is useful to break down partnership income by industry, using irs data (see Table 2).

